


-

-
 比特币Layer2爆发前夜 我们可以从以太坊L2上学到什么?
比特币生态再次迎来了自己的春天,吸引了大量的资金、用户和开发者。
-
 io.net:连接全球GPU资源 重塑机器学习的未来
io.net是一个基于Solana, Render, Ray, 和Filecoin的分布式GPU系统,旨在利用分布式GPU资源来解决AI和机器学习领域的计算挑战。
-
J Research:2024年Web3游戏行业趋势深度洞察
J Lab历时近两个月,翻阅整理了20+份研报,多维度搜集了行业数据,在梳理行业生态全景的基础上,剖析了Web3游戏在2024年呈现的新特征与人才动向,旨在为关注行业的小伙伴提供有价值的参考。
-
 SevenX Ventures:UXLINK如何通过“执两用中”突破 Web3 社交天花板?
UXLINK采用了“执两用中”的叙事脉络和产品构思,具备更强的可延展性和无限天花板。
-
 4E金融卡 可匿名消费的合规加密货币Visa卡
随着在全球经济中的地位日益显著,加密货币正逐渐成为全球财富管理和交易的新宠。
-
-
首日“吸金”逾5000万美元,浅析Synthetix创始人的新项目Infinex
积分是否会转换为代币?答案或许不太理想。
-
 遥遥领先的OpenAI慢下来了
“如果发布的是GPT-5,那OpenAI依然遥遥领先。如果是AI Search或者是语音助手,那就说明OpenAI没落了。”
-
 SocialFi 赛道暗流涌动 Friend.tech、Farcaster 及 Phaver 谁略胜一筹?
Friend.tech 凭借 V2 版本再次引领了市场的热潮,这次可以逃过 SocialFi 旁氏陷阱吗?
-
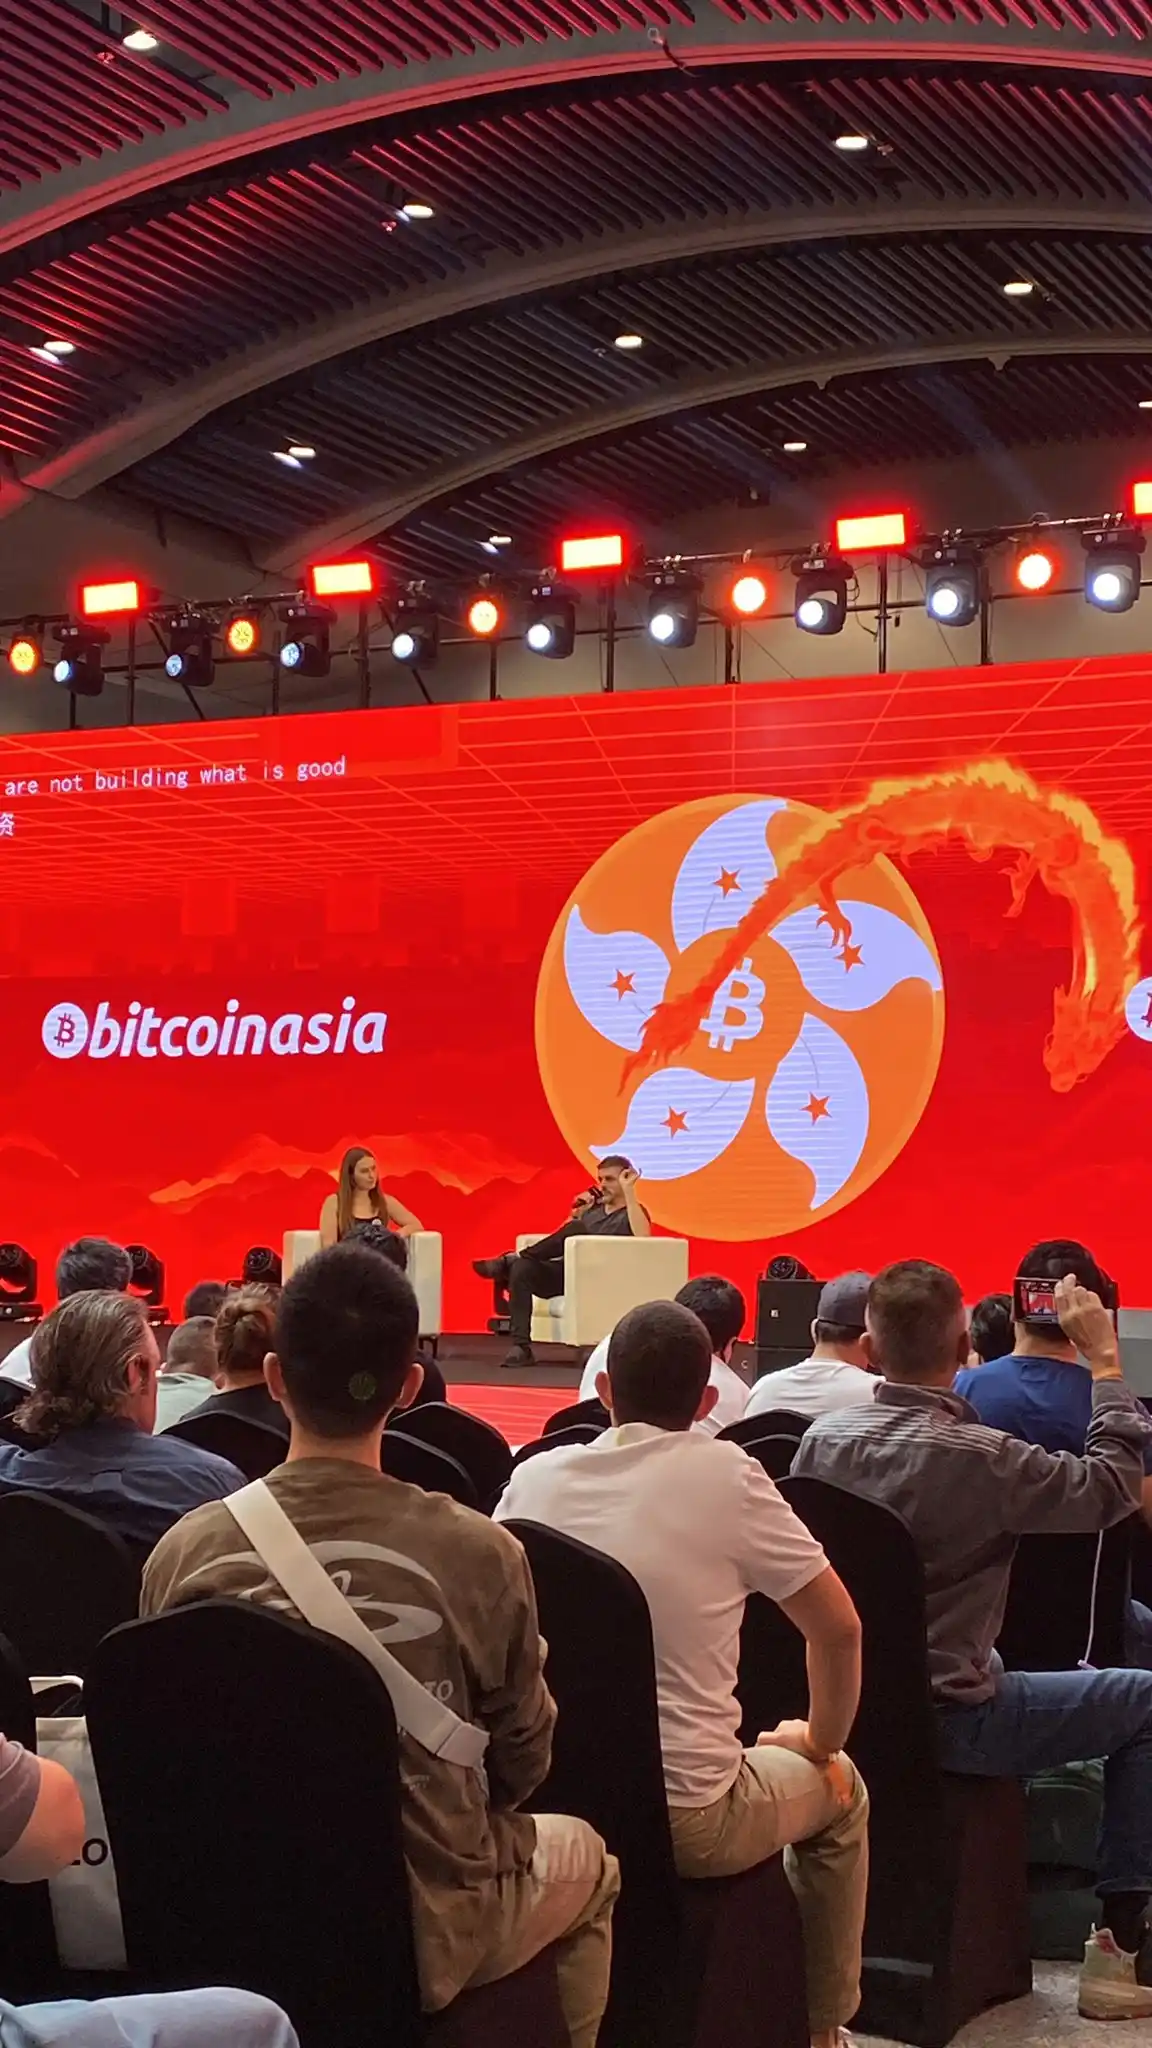 比特币大会落幕,所见所闻为我们指引了哪些方向?
Casey造词「冥钞」;Domo摘下口罩;穿着巫师服的老外们在Party洗澡,刚落幕的BTC大会都发生了什么。
-
 特朗普和拜登,打响“加密大选”之战
加密选票,争还是不争?
-
Worldcoin恐现「恶性通膨」,抛售潮或长达数月
随著 WLD 解锁量不断增加,很快将出现恶性通膨,并在接下来的几个月爆发抛售潮。
-
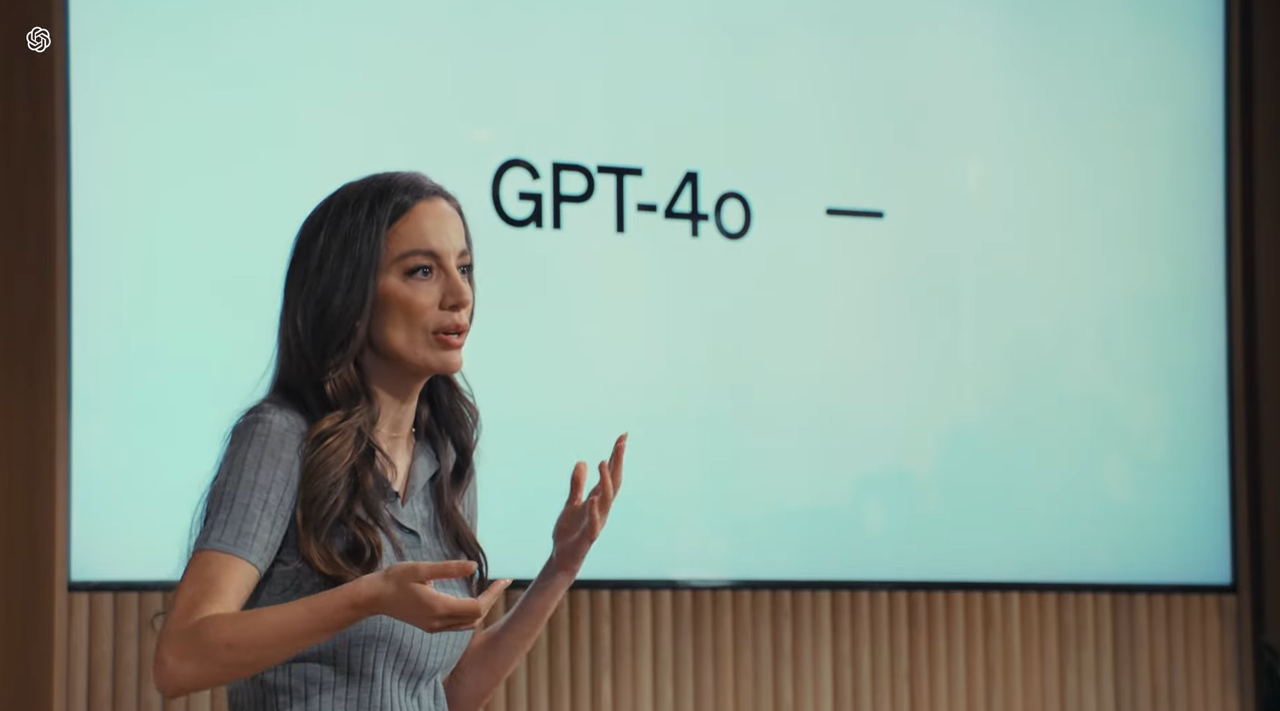
 GPT-4o 震撼发布:3EX AI交易为全球用户带来全新 AI 体验
OpenAI 正式宣布推出GPT-4o,不仅在技术上实现巨大飞跃,更在用户体验方面带来了革命性的改进,期待 GPT-4o 和3EX AI交易平台带来的更多惊喜!
-
 短线交易好帮手:用3EX AI交易效果翻倍
3EX AI交易能够帮助用户高效地把握短期交易机会,实现更快速的投资回报,为用户提供高效、安全、智能的交易体验。
-
SignalPlus宏观分析(20240514):数据预期不容乐观,通胀恐将开始反弹
昨天市场以一个安静的交易日开启新的一周,不过接下来几天将有多个可能影响市场的经济数据公布。虽然加密货币狂热最近有所平息,不过著名的TradFi meme股票OG(Roaring Kitty) 昨天在Twitter(X)上凯旋归来。
-
 并行EVM新星Lumio:以太坊可扩展性新原语的白衣骑士
后坎昆升级时代,以太坊等效性不再具有先天正确性。
-
 EMC Labs 比特币每周观察: 脆弱平衡中 BTC或迎短期考验
比特币因美联储政策波动,显示出风险资产特性,市场观望情绪浓,交易量萎缩,关键支撑位面临考验。
-
 区块链互操作性的 2.0 时刻:链爆炸与链抽象
虽然这样说可能有些夸张,但应用创新的速度可能都不如公链新增的速度。
-
昔日逼死华尔街机构的王者再度归来,Roaring Kitty将再次点燃Meme市场?
Roaring Kitty的回归伴随了Meme板块的上涨,或有望为市场带来新的热点。
-
疯狂回调70%,数据解读Solana Meme狂潮的另一面
相当多的 Meme 的 ATH 超过了 1 亿美元,但真正能够持续保持的很少。
-
 ChatGPT-4o,OpenAI的一小步,人类「AI助理」的一大步
科幻电影「Her」的剧情正在成为现实。
-
Restaking的“吸血鬼”攻击之下,Lido该如何解题?
市占率从32%下降至29%,Lido主动求变。
-
 美股「散户的王」回来了,第一天就爆打了对冲基金
Roaring Kitty,王者归来。
-
 大摩:关于火爆的“AI供电股”,这是几个关键的问题
大型科技公司在AI时代的新烦恼:如何找到足够的电力,AI的尽头是电力!能源投资者如何逐浪AI?押注电力股?
-
 Web3 游戏周报(5.05 - 5.11)
Web3 游戏行业动态及排行榜
-
 2024 年 4 月公链研报:比特币减半、市场回调以及关键进展
2024 年 4月,公链领域关键发展包括:比特币减半、市场下跌以及 TON 和 Base 发展迅猛。
-
BTC减半后的动态平衡:挖矿收入骤降,关机价来到5.5万美元
从本质上说,每一次减半都是市场供需的又一次动态平衡。在这个再平衡的过程中,市场资金有哪些动向值得关注?
-
 OKX在澳洲推出虚拟货币交易所 提供现货及衍生产品交易
2024年5月14日,Web3科技公司暨虚拟资产交易所OKX,宣布正式在澳洲推出其虚拟货币交易所,为所有用户提供现货买卖交易。
-
 最大BTC ETF持有者易主 狂投3.8亿美元押注
据报道,目前BTC ETF市场出现了正流入,打破了持续近一个月的连续流出。


- -中国人民银行、银保监会等十部委
根据央行等部门发布“关于进一步防范和处置虚拟货币交易炒作风险的通知”,本文内容仅用于信息分享,不对任何经营与投资行为进行推广与背书,请严格遵守所在地区法律法规,不参与任何非法金融行为。