


加密货币市场今日惨淡:监管打击与市场情绪导致大幅下跌
The encrypt currency market today is bleak: regulatory strikes and market sentiment have led to a sharp decline
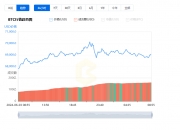
今日的加密货币市场走势可以说是异常惨淡,比特币多次失守66000美元关口,以太坊也同样数次跌破3500美元。截至撰稿时间,比特币报价为65472美元,以太坊报价为3524美元,两大主流加密货币均下跌约1%。
Today’s trend in the encrypt currency market can be described as extremely bleak, with Bitcoin repeatedly failing at the $66,000 threshold, and the same number of times falling at $3,500. At the time of writing, Bitcoin was quoted at $65,472 and at $3524, with the two major encrypt currencies falling by about 1%.
监管压力与市场抛售
Regulatory pressure and market dumping
大多数投资者认为,监管打击是引发加密货币下跌的主要原因。不断增加的监管审查和更严格的规定可能降低投资者对加密货币的信心,从而导致市场大量抛售。此外,如果全球经济显著恶化或爆发出更大的金融危机,这也将导致加密货币遭到大量抛售。
Increased regulatory scrutiny and stricter regulations may reduce investors’ confidence in encrypted currencies, leading to large-scale market sales. Moreover, if the global economy significantly deteriorates or a larger financial crisis erupts, it will lead to large-scale sales of encrypted currencies.
自然修正与市场回调
Natural fixes and market returns
当价格达到不可持续的水平时,通常会出现显著的回调情况。这是一种获利回吐和市场饱和的自然修正。投资者应保持警惕,密切关注市场动态,以便及时调整投资策略。
When prices reach unsustainable levels, there is usually a significant rebound. This is a natural correction of profitability and market saturation. Investors should remain vigilant and closely monitor market dynamics so that investment strategies can be adjusted in a timely manner.
?

比特币走势分析:多头反弹还是空头延续?
Bitcoin's Trends Analysis: Multiple Retrenchments or Creatures?
当前比特币市场的走势充满了不确定性,但技术指标为我们提供了一些关键的信号和洞见。
The current trend in the Bitcoin market is fraught with uncertainty, but technical indicators provide us with some key signals and insights.
MACD指标解析
MACD Indicators Parsing
从MACD指标来看,DIF线和DEA线目前都在0轴下方运行,并且两条线有靠拢的迹象。这表明比特币的价格仍然处于空头趋势中,但下行动能有所减弱。尽管MACD柱状图呈现红色状态,但逐渐缩短,这意味着空头力量正在减弱。
According to MACD indicators, both the DIF and the DAA lines are currently operating below the 0-axis, and there are signs of convergence between the two lines. This suggests that bitcoin prices are still in the middle of a trend, but below-the-ground action is reduced.
KDJ指标解读
KDJ Indicator Interpretation
在KDJ指标上,K线值和D线值均在50下方,处于较低水平,而J线值已经进入超卖区域。这表明市场可能存在短期反弹的可能性。随着K线和D线逐步靠拢,关注J线的走势将是判断反弹力度的重要依据。
On KDJ indicators, the K-line value and the D-line value are below 50, at a lower level, while the J-line value is already in the oversold area. This suggests that there is a potential for short-term rebound in the market.
布林带指标观察
Bullin indicators observations
从布林带指标来看,比特币价格目前徘徊在4小时级别中轨(66215)附近,这一位置对价格形成了有效支撑。如果价格能够突破中轨线,下一步将有望向上轨(66975)靠近,进一步确认多头趋势。
According to the Bryn indicators, bitcoin prices are currently hovering near the 4-hour intermediate track (66215), a position that effectively supports prices. If prices break through the middle track, the next step is likely to move closer to the upper track (66975), further confirming the multi-faceted trend.

比特币价格能否突破关键阻力?短期反弹是否会成为多头逆袭的开始?
Will the price of 市场在等待一个明确的方向,您是否也在寻找下一个投资机会?关注这些关键技术指标,或许能为您的投资决策提供一些重要的参考。 The market is waiting for a clear direction. Are you looking for the next investment opportunity? Focusing on these key technology indicators may provide some important references for your investment decisions. 当前比特币市场动荡不安,各种技术指标交织出复杂的信号。深入剖析这些指标,揭开市场背后的趋势和动向。 The current market is volatile in Bitcoin, and a variety of technological indicators are interwoven with complex signals. A deeper analysis of these indicators reveals the trends and trends behind the market. MACD指标分析 MACD Indicator Analysis 当前MACD指标显示,DIF线和DEA线均在0轴下方运行,且DIF线逐渐远离DEA线,这表明下跌动能较强。MACD红色柱状图有所放大,意味着空头力量正在增强,短期内可能会继续下跌。空头趋势是否会持续?关键还在于未来几小时的动向。 The current MACD indicators show that both the DIF and the DAA lines are operating below the 0-axis and that the DIF lines are gradually moving away from the DAA line, suggesting that the downside power is stronger. The MAD red-column graphs are magnified, meaning that the empty power is increasing and may continue to fall in the short term. Will the empty trend continue? KDJ指标解读 KDJ Indicator Interpretation 在KDJ指标中,K线值和D线值均处于低位,显示出下行趋势,而J线值已经接近超卖区。这表明市场可能会在低位震荡一段时间。关键在于K线和D线是否会在低位交叉向上,若出现这一信号,可能预示着短期反弹的开始。KDJ指标会否给出反弹信号?这一点值得密切关注。 The K-line and D-line values are both low in KDJ indicators, showing a downward trend, while the J-line values are close to the overselling area. This suggests that the market may be convulsing for a period of time. The key is whether the K- and D-lines will cross up at the lower position. 布林带指标观察 Bullin indicators observations 布林带指标显示,当前比特币价格已经跌破中轨,并逐渐向下轨靠近,表明市场处于弱势状态。然而,下轨支撑位(65078)成为关注的焦点。如果价格跌破这一位置,市场可能会进一步下行;反之,若在此获得支撑,反弹模式或将开启。下轨支撑能否稳住市场?这将决定接下来的走势。 Boolean indicators show that the current bitcoin price is in the middle track and moving closer to the lower track, indicating that the market is in a weak position. However, the lower track support position (65078) is the focus of attention. If prices fall in this position, the market may fall further; if supported, the rebound pattern may start. 分析:在1小时级别图中,虽然短期内存在反弹迹象,但4小时级别图显示整体趋势依旧偏弱。短期反弹的力度可能有限,价格未能明确站上布林带中轨且MACD快慢线未明显向上交叉之前,市场可能以震荡或偏弱为主。关键支撑位65078是否能守住,将是短期走势的决定性因素。 Analysis: in the one-hour scale map, although there are signs of a rebound in the short term, the four-hour level chart shows that the overall trend is weak. Short-term rebounds may be limited, prices may not be clear and markets may be dominated by oscillations or weaknesss before the fast-tracking line of the MACD is crossed up. The ability of the critical supporting position of 65078 will be a determining factor in short-term trends. 比特币即将迎来关键时刻,65078的支撑能否稳住?反弹行情是否会出现? At this critical moment for Bitcoin, can the support of 65078 hold? Will the rebound occur? 不确定性笼罩市场,但关键时刻往往也是绝佳的投资机会。请继续关注我们的最新分析,让我们一起揭开比特币接下来的走势谜团! Uncertainty looms over the market, but this is often an excellent investment opportunity. Keep your eye on our latest analysis and let's open up the mystery of Bitcoin's next move!
比特币行情深度解析:反弹在即还是继续探底?
注册有任何问题请添加 微信:MVIP619 拉你进入群

打开微信扫一扫
添加客服
进入交流群


发表评论